1960: The Year The Singularity Was Cancelled
April 22, 2019
Epistemic status: Very speculative, especially Parts 3 and 4. Like many good things, this post is based on a conversation with Paul Christiano; most of the good ideas are his, any errors are mine.
I
In the 1950s, an Austrian scientist discovered a series of equations that he claimed could model history. They matched past data with startling accuracy. But when extended into the future, they predicted the world would end on November 13, 2026.
This sounds like the plot of a sci-fi book. But it’s also the story of Heinz von Foerster, a mid-century physicist, cybernetician, cognitive scientist, and philosopher.
His problems started when he became interested in human population dynamics.
(the rest of this section is loosely adapted from his Science paper “Doomsday: Friday, 13 November, A.D. 2026”)
Assume a perfect paradisiacal Garden of Eden with infinite resources. Start with two people – Adam and Eve – and assume the population doubles every generation. In the second generation there are 4 people; in the third, 8. This is that old riddle about the grains of rice on the chessboard again. By the 64th generation (ie after about 1500 years) there will be 18,446,744,073,709,551,616 people – ie about about a billion times the number of people who have ever lived in all the eons of human history. So one of our assumptions must be wrong. Probably it’s the one about the perfect paradise with unlimited resources.
Okay, new plan. Assume a world with a limited food supply / limited carrying capacity. If you want, imagine it as an island where everyone eats coconuts. But there are only enough coconuts to support 100 people. If the population reproduces beyond 100 people, some of them will starve, until they’re back at 100 people. In the second generation, there are 100 people. In the third generation, still 100 people. And so on to infinity. Here the population never grows at all. But that doesn’t match real life either.
But von Foerster knew that technological advance can change the carrying capacity of an area of land. If our hypothetical islanders discover new coconut-tree-farming techniques, they may be able to get twice as much food, increasing the maximum population to 200. If they learn to fish, they might open up entirely new realms of food production, increasing population into the thousands.
So the rate of population growth is neither the double-per-generation of a perfect paradise, nor the zero-per-generation of a stagnant island. Rather, it depends on the rate of economic and technological growth. In particular, in a closed system that is already at its carrying capacity and with zero marginal return to extra labor, population growth equals productivity growth.
What causes productivity growth? Technological advance. What causes technological advance? Lots of things, but von Foerster’s model reduced it to one: people. Each person has a certain percent chance of coming up with a new discovery that improves the economy, so productivity growth will be a function of population.
So in the model, the first generation will come up with some small number of technological advances. This allows them to spawn a slightly bigger second generation. This new slightly larger population will generate slightly more technological advances. So each generation, the population will grow at a slightly faster rate than the generation before.
This matches reality. The world population barely increased at all in the millennium from 2000 BC to 1000 BC. But it doubled in the fifty years from 1910 to 1960. In fact, using his model, von Foerster was able to come up with an equation that predicted the population near-perfectly from the Stone Age until his own day.
But his equations corresponded to something called hyperbolic growth. In hyperbolic growth, a feedback cycle – in this case population causes technology causes more population causes more technology – leads to growth increasing rapidly and finally shooting to infinity. Imagine a simplified version of Foerster’s system where the world starts with 100 million people in 1 AD and a doubling time of 1000 years, and the doubling time decreases by half after each doubling. It might predict something like this:
| Year | Population |
|---|---|
| 1 AD | 100 million people |
| 1000 AD | 200 million people |
| 1500 AD | 400 million people |
| 1750 AD | 800 million people |
| 1875 AD | 1600 million people |
…and so on. This system reaches infinite population in finite time (ie before the year 2000). The real model that von Foerster got after analyzing real population growth was pretty similar to this, except that it reached infinite population in 2026, give or take a few years (his pinpointing of Friday November 13 was mostly a joke; the equations were not really that precise).
What went wrong? Two things.
First, as von Foerster knew (again, it was kind of a joke) the technological advance model isn’t literally true. His hyperbolic model just operates as an upper bound on the Garden of Eden scenario. Even in the Garden of Eden, population can’t do more than double every generation.
Second, contra all previous history, people in the 1900s started to have fewer kids than their resources could support ( the demographic transition). Couples started considering the cost of college, and the difficulty of maternity leave, and all that, and decided that maybe they should stop at 2.5 kids (or just get a puppy instead).
Von Foerster published has paper in 1960, which ironically was the last year that his equations held true. Starting in 1961, population left its hyperbolic growth path. It is now expected to stabilize by the end of the 21st century.
II
But nobody really expected the population to reach infinity. Armed with this story, let’s look at something more interesting.
This (source) might be the most depressing graph ever:

The horizontal axis is years before 2020, a random year chosen so that we can put this in log scale without negative values screwing everything up. This is an arbitrary choice, but you can also graph it with log GDP as the horizontal axis and find a similar pattern.
The vertical axis is the amount of time it took the world economy to double from that year, according to this paper. So for example, if at some point the economy doubled every twenty years, the dot for that point is at twenty. The doubling time decreases throughout most of the period being examined, indicating hyperbolic growth.
Hyperbolic growth, as mentioned before, shoots to infinity at some specific point. On this graph, that point is represented by the doubling time reaching zero. Once the economy doubles every zero years, you might as well call it infinite.
For all of human history, economic progress formed a near-perfect straight line pointed at the early 21st century. Its destination varied by a century or two now and then, but never more than that. If an ancient Egyptian economist had modern techniques and methodologies, he could have made a graph like this and predicted it would reach infinity around the early 21st century. If a Roman had done the same thing, using the economic data available in his own time, he would have predicted the early 21st century too. A medieval Burugundian? Early 21st century. A Victorian Englishman? Early 21st century. A Stalinist Russian? Early 21st century. The trend was really resilient.
In 2005, inventor Ray Kurzweil published The Singularity Is Near, claiming there would be a technological singularity in the early 21st century. He didn’t refer to this graph specifically, but he highlighted this same trend of everything getting faster, including rates of change. Kurzweil took the infinity at the end of this graph very seriously; he thought that some event would happen that really would catapult the economy to infinity. Why not? Every data point from the Stone Age to the Atomic Age agreed on this.
This graph shows the Singularity getting cancelled.
Around 1960, doubling times stopped decreasing. The economy kept growing. But now it grows at a flat rate. It shows no signs of reaching infinity; not soon, not ever. Just constant, boring 2% GDP growth for the rest of time.
Why?
Here von Foerster has a ready answer prepared for us: population!
Economic growth is a function of population and productivity. And productivity depends on technological advancement and technological advancement depends on population, so it all bottoms out in population in the end. And population looked like it was going to grow hyperbolically until 1960, after which it stopped. That’s why hyperbolic economic growth, ie progress towards an economic singularity, stopped then too.
In fact…
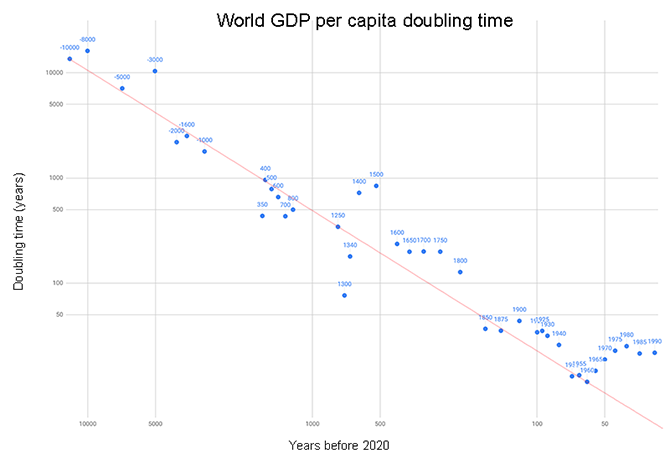
This is a really sketchy graph of per capita income doubling times. It’s sketchy because until 1650, per capita income wasn’t really increasing at all. It was following a one-step-forward one-step-back pattern. But if you take out all the steps back and just watch how quickly it took the steps forward, you get something like this.
Even though per capita income tries to abstract out population, it displays the same pattern. Until 1960, we were on track for a singularity where everyone earned infinite money. After 1960, the graph “bounces back” and growth rates stabilize or even decrease.
Again, von Foerster can explain this to us. Per capita income grows when technology grows, and technology grows when the population grows. The signal from the end of hyperbolic population growth shows up here too.
To make this really work, we probably have to zoom in a little bit and look at concrete reality. Most technological advances come from a few advanced countries whose population stabilized a little earlier than the world population. Of the constant population, an increasing fraction are becoming researchers each year (on the other hand, the low-hanging fruit gets picked off and technological advance becomes harder with time). All of these factors mean we shouldn’t expect productivity growth/GWP per capita growth/technological growth to exactly track population growth. But on the sort of orders-of-magnitude scale you can see on logarithmic graphs like the ones above, it should be pretty close.
So it looks like past predictions of a techno-economic singularity for the early 21st century were based on extrapolations of a hyperbolic trend in technology/economy that depended on a hyperbolic trend in population. Since the population singularity didn’t pan out, we shouldn’t expect the techno-economic singularity to pan out either. In fact, since population in advanced countries is starting to “stagnate” relative to earlier eras, we should expect a relative techno-economic stagnation too.
…maybe. Before coming back to this, let’s explore some of the other implications of these models.
III
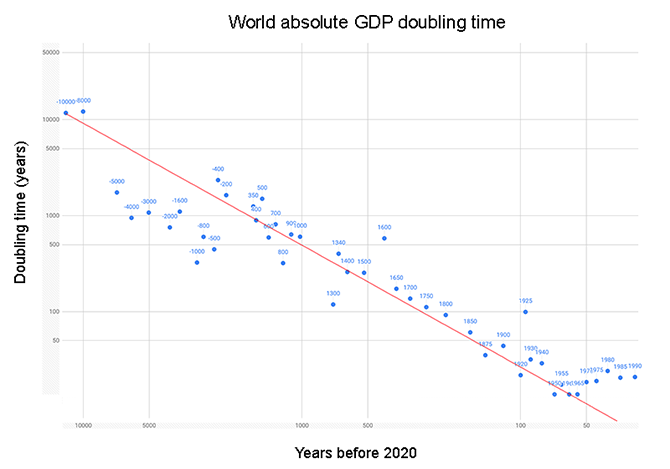
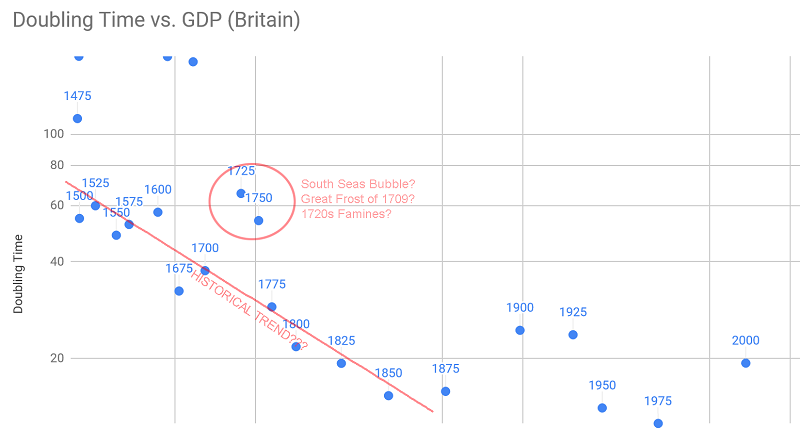
The first graph is the same one you saw in the last section, of absolute GWP doubling times. The second graph is the same, but limited to Britain.
Where’s the Industrial Revolution?
It doesn’t show up at all. This may be a surprise if you’re used to the standard narrative where the Industrial Revolution was the most important event in economic history. Graphs like this make the case that the Industrial Revolution was an explosive shift to a totally new growth regime:
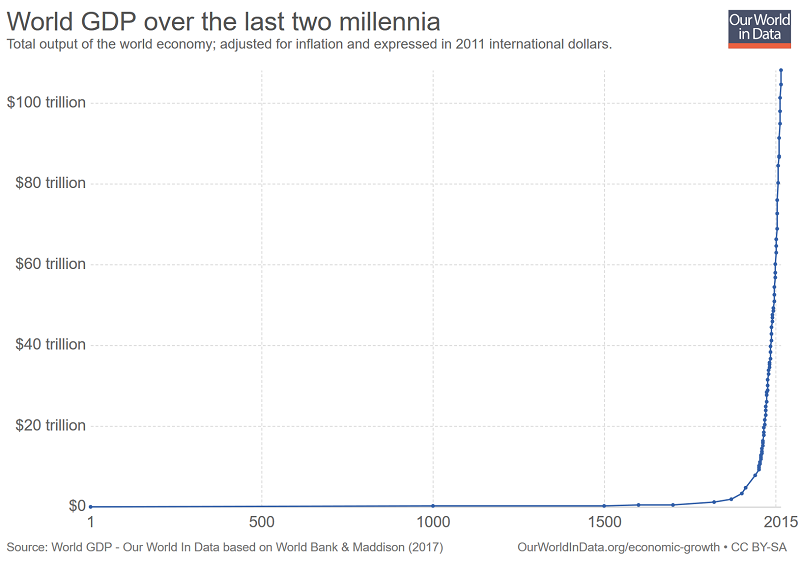
It sure looks like the Industrial Revolution was a big deal. But Paul Christiano argues your eyes may be deceiving you. That graph is a hyperbola, ie corresponds to a single simple equation. There is no break in the pattern at any point. If you transformed it to a log doubling time graph, you’d just get the graph above that looks like a straight line until 1960.
On this view, the Industiral Revolution didn’t change historical GDP trends. It just shifted the world from a Malthusian regime where economic growth increased the population to a modern regime where economic growth increased per capita income.
For the entire history of the world until 1000, GDP per capita was the same for everyone everywhere during all historical eras. An Israelite shepherd would have had about as much stuff as a Roman farmer or a medieval serf.
This was the Malthusian trap, where “productivity produces people, not prosperity”. People reproduce to fill the resources available to them. Everyone always lives at subsistence level. If productivity increases, people reproduce, and now you have more people living at subsistence level. OurWorldInData has an awesome graph of this:
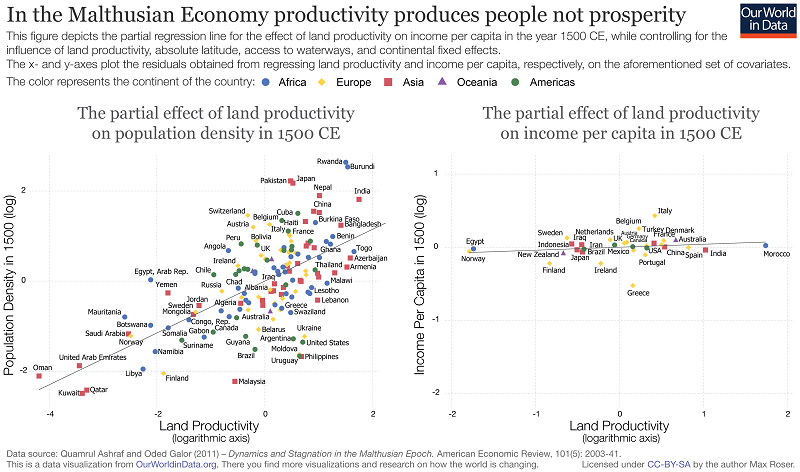
As of 1500, places with higher productivity (usually richer farmland, but better technology and social organization also help) population density is higher. But GDP per capita was about the same everywhere.
There were always occasional windfalls from exciting discoveries or economic reforms. For a century or two, GDP per capita would rise. But population would always catch up again, and everyone would end up back at subsistence.
Some people argue Europe broke out of the Malthusian trap around 1300. This is not quite right. 1300s Europe achieved above-subsistence GDP, but only because the Black Plague killed so many people that the survivors got a windfall by taking their land.
Malthus predicts that this should only last a little while, until the European population bounces back to pre-Plague levels. This prediction was exactly right for Southern Europe. Northern Europe didn’t bounce back. Why not?
Unclear, but one answer is: fewer people, more plagues. Broadberry 2015 mentions that Northern European culture promoted later marriage and fewer children:
The North Sea Area had an advantage in this area because of its approach to marriage. Hajnal (1965) argued that northwest Europe had a different demographic regime from the rest of the world, characterised by later marriage and hence limited fertility. Although he originally called this the European Marriage Pattern, later work established that it applied only to the northwest of the continent. This can be linked to the availability of labour market opportunities for females, who could engage in market activity before marriage, thus increasing the age of first marriage for females and reducing the number of children conceived (de Moor and van Zanden, 2010). Later marriage and fewer children are associated with more investment in human capital, since the womenemployed in productive work can accumulate skills, and parents can afford to invest more in each of the smaller number of children because of the “quantity-quality” trade-off (Voigtländer and Voth, 2010).
This low birth rate was happening at the same time plagues were raising the death rate. Here’s another amazing graph from OurWorldInData:
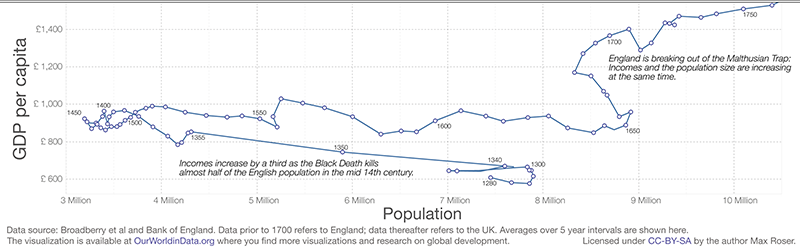
British population maxes out around 1300 (?), declines substantially during the Black Plague of 1348-49, but then keeps declining. The List Of English Plagues says another plague hit in 1361, then another in 1369, then another in 1375, and so on. Some historians call the whole period from 1348 to 1666 “the Plague Years”.
It looks like through the 1350 – 1450 period, population keeps declining, and per capita income keeps going up, as Malthusian theory would predict.
Between 1450 and 1550, population starts to recover, and per capita incomes start going down, again as Malthus would predict. Then around 1560, there’s a jump in incomes; according to the List Of Plagues, 1563 was “probably the worst of the great metropolitan epidemics, and then extended as a major national outbreak”. After 1563, population increases again and per capita incomes decline again, all the way until 1650. Population does not increase in Britain at all between 1660 and 1700. Why? The List declares 1665 to be “The Great Plague”, the largest in England since 1348.
So from 1348 to 1650, Northern European per capita incomes diverged from the rest of the world’s. But they didn’t “break out of the Malthusian trap” in a strict sense of being able to direct production toward prosperity rather than population growth. They just had so many plagues that they couldn’t grow the population anyway.
But in 1650, England did start breaking out of the Malthusian trap; population and per capita incomes grow together. Why?
Paul theorizes that technological advance finally started moving faster than maximal population growth.
Remember, in the von Foerster model, the growth rate increases with time, all the way until it reaches infinity in 2026. The closer you are to 2026, the faster your economy will grow. But population can only grow at a limited rate. In the absolute limit, women can only have one child per nine months. In reality, infant mortality, infertility, and conscious decision to delay childbearing mean the natural limits are much lower than that. So there’s a theoretical limit on how quickly the population can increase even with maximal resources. If the economy is growing faster than that, Malthus can’t catch up.
Why would this happen in England and Holland in 1650?
Lots of people have historical explanations for this. Northern European population growth was so low that people were forced to invent labor-saving machinery; eventually this reached a critical mass, we got the Industrial Revolution, and economic growth skyrocketed. Or: the discovery of America led to a source of new riches and a convenient sink for excess population. Or: something something Protestant work ethic printing press capitalism. These are all plausible. But how do they sync with the claim that absolute GDP never left its expected trajectory?
I find the idea that the Industrial Revolution wasn’t a deviation from trend fascinating and provocative. But it depends on eyeballing a lot of graphs that have had a lot of weird transformations done to them, plus writing off a lot of outliers. Here’s another way of presenting Britain’s GDP and GDP per capita data:
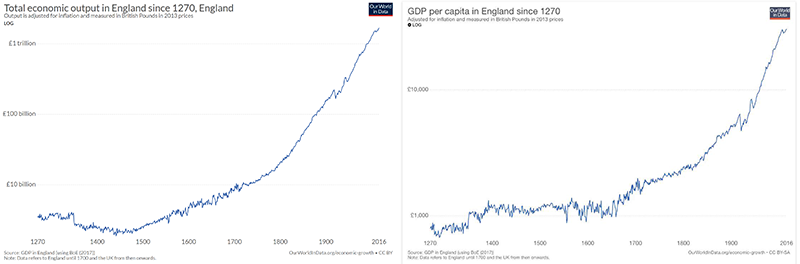
Here it’s a lot less obvious that the Industrial Revolution represented a deviation from trend for GDP per capita but not for GDP.
These British graphs show less of a singularity signature than the worldwide graphs do, probably because we’re looking at them on a shorter timeline, and because the Plague Years screwed everything up. If we insisted on fitting them to a hyperbola, it would look like this:
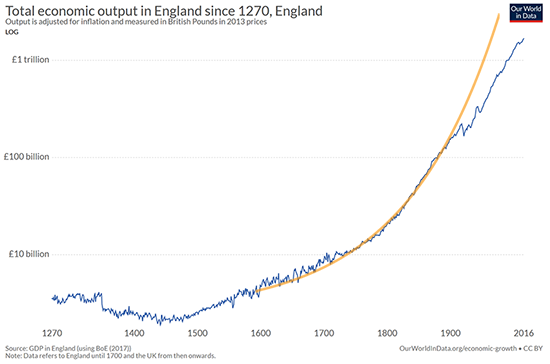
Like the rest of the world, Britain was only on a hyperbolic growth trajectory when economic growth was translating into population growth. That wasn’t true before about 1650, because of the plague. And it wasn’t true after about 1850, because of the Demographic Transition. We see a sort of fit to a hyperbola between those points, and then the trend just sort of wanders off.
It seems possible that the Industrial Revolution was not a time of abnormally fast technological advance or economic growth. Rather, it was a time when economic growth outpaced population growth, causing a shift from a Malthusian regime where productivity growth always increased population at subsistence level, to a modern regime where productivity growth increases GDP per capita. The world remained on the same hyperbolic growth trajectory throughout, until the trajectory petered out around 1900 in Britain and around 1960 in the world as a whole.
IV
So just how cancelled is the singularity?
To review: population growth increases technological growth, which feeds back into the population growth rate in a cycle that reaches infinity in finite time.
But since population can’t grow infinitely fast, this pattern breaks off after a while.
The Industrial Revolution tried hard to compensate for the “missing” population; it invented machines. Using machines, an individual could do an increasing amount of work. We can imagine making eg tractors as an attempt to increase the effective population faster than the human uterus can manage. It partly worked.
But the industrial growth mode had one major disadvantage over the Malthusian mode: tractors can’t invent things. The population wasn’t just there to grow the population, it was there to increase the rate of technological advance and thus population growth. When we shifted (in part) from making people to making tractors, that process broke down, and growth (in people and tractors) became sub-hyperbolic.
If the population stays the same (and by “the same”, I just mean “not growing hyperbolically”) we should expect the growth rate to stay the same too, instead of increasing the way it did for thousands of years of increasing population, modulo other concerns.
In other words, the singularity got cancelled because we no longer have a surefire way to convert money into researchers. The old way was more money = more food = more population = more researchers. The new way is just more money = send more people to college, and screw all that.
But AI potentially offers a way to convert money into researchers. Money = build more AIs = more research.
If this were true, then once AI comes around – even if it isn’t much smarter than humans – then as long as the computational power you can invest into researching a given field increases with the amount of money you have, hyperbolic growth is back on. Faster growth rates means more money means more AIs researching new technology means even faster growth rates, and so on to infinity.
Presumably you would eventually hit some other bottleneck, but things could get very strange before that happens.