Book Review: Secular Cycles
August 12, 2019
I
There is a tide in the affairs of men. It cycles with a period of about three hundred years. During its flood, farms and businesses prosper, and great empires enjoy golden ages. During its ebb, war and famine stalk the land, and states collapse into barbarism.
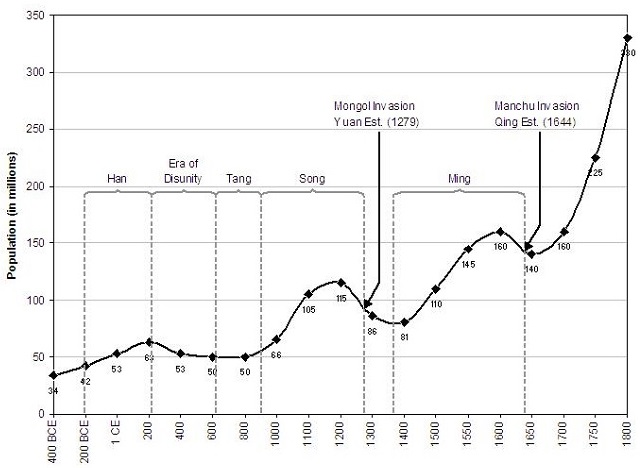
Chinese population over time
At least this is the thesis of Peter Turchin and Sergey Nefedov, authors of Secular Cycles. They start off Malthusian: due to natural reproduction, population will keep increasing until it reaches the limits of what the land can support. At that point, everyone will be stuck at subsistence level. If any group ever enjoys a standard of living above subsistence level, they will keep reproducing until they are back down at subsistence.
Standard Malthusian theory evokes images of a population stable at subsistence level forever. But Turchin and Nefedov argues this isn’t how it works. A population at subsistence will always be one meal away from starving. When a famine hits, many of them will starve. When a plague hits, they will already be too sickly to fight it off. When conflict arrives, they will be desperate enough to enlist in the armies of whichever warlord can offer them a warm meal.
These are not piecemeal events, picking off just enough of the population to bring it back to subsistence. They are great cataclysms. The Black Plague killed 30% – 60% of Europeans; the Antonine Plague of Rome was almost as deadly. The Thirty Years War killed 25% – 40% of Germans; the Time of Troubles may have killed 50% of medieval Russia.
Thus the secular cycle. When population is low, everyone has more than enough land. People grow rich and reproduce. As time goes on, the same amount of farmland gets split among more and more people. Wages are driven down to subsistence. War, Famine, and Pestilence ravage the land, with Death not far behind. The killings continue until population is low again, at which point the cycle starts over.
This applies mostly to peasants, who are most at risk of starving. But nobles go through a related process. As a cycle begins, their numbers are low. As time goes on, their population expands, both through natural reproduction and through upward mobility. Eventually, there are more nobles than there are good positions…
(this part confused me a little. Shouldn’t number of good positions scale with population? IE if one baron rules 1,000 peasants, the number of baronial positions should scale with the size of a society. I think T&N hint at a few answers. First, some positions are absolute rather than relative, eg “King” or “Minister of the Economy”. Second, noble numbers may sometimes increase faster than peasant numbers, since nobles have more food and better chances to reproduce. Third, during boom times, the ranks of nobles are swelled through upward mobility. Fourth, conspicuous consumption is a ratchet effect: during boom times, the expectations of nobility should gradually rise. Fifth, sometimes the relevant denominator is not peasants but land: if a noble only has one acre of land, it doesn’t matter how many peasants he controls. Sixth, nobles usually survive famines and plagues pretty well, so after those have done their work, there are far fewer peasants but basically the same number of nobles. All of these factors contribute to excess noble population – or as T&N call it, “elite overproduction”)
…and the nobles form “rival patronage networks” to fight for the few remaining good spots. The state goes from united (or at least all nobles united against the peasants) to divided, with coalitions of nobles duking it out (no pun intended). This can lead either to successful peasant rebellion, as some nobles support the peasants as part of inter-noble power plays, or just to civil war. Although famine and plague barely affect nobles, war affects them disproportionately – both because they were often knights or other front-line soldiers, and because killing the other side’s nobles was often a major strategic goal (think Game of Thrones). So a civil war usually further depletes the already-depleted peasant population, and finally depletes noble populations, leading to a general underpopulation and the beginning of the next cycle.
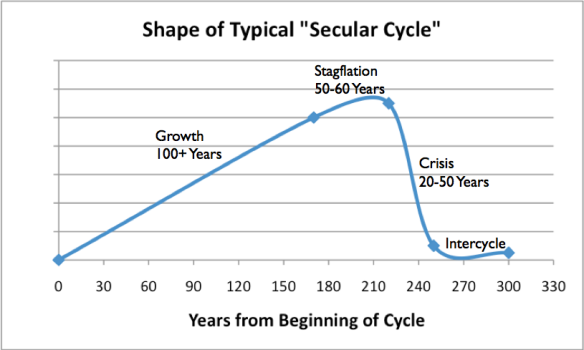
Combine these two processes, and you get the basic structure of a secular cycle. There are about a hundred years of unalloyed growth, as peasant and noble populations rebound from the last disaster. During this period, the economy is strong, the people are optimistic and patriotic, and the state is strong and united.
After this come about fifty years of “stagflation”. There is no more room for easy growth, but the system is able to absorb the surplus population without cracking. Peasants may not have enough land, but they go to the city in search of jobs. Nobles may not have enough of the positions they want, but they go to college in order to become bureaucrats, or join the retinues of stronger nobles. The price of labor reaches its lowest point, and the haves are able to exploit the desperation of the have-nots to reach the zenith of their power. From the outside, this period can look like a golden age: huge cities buzzing with people, universities crammed with students, ultra-rich nobles throwing money at the arts and sciences. From the inside, for most people it will look like a narrowing of opportunity and a hard-to-explain but growing sense that something is wrong.
After this comes a crisis. The mechanisms that have previously absorbed surplus population fail. Famine and disease ravage the peasantry. State finances fall apart. Social trust and patriotism disappear as it becomes increasingly obvious that it’s every man for himself and that people with scruples will be defeated or exploited by people without.
After this comes the depression period (marked “intercycle” on the graph above, but I’m going to stick with the book’s term). The graph makes it look puny, but it can last 100 to 150 years. During this period, the peasant population is low, but the noble population is still high. This is most likely an era of very weak or even absent state power, barbarian invasions, and civil war. The peasant population is in a good position to expand, but cannot do so because wars keep killing people off or forcing them into walled towns where they can’t do any farming. Usually it takes a couple more wars and disasters before the noble population has decreased enough to reverse elite overproduction. At this point the remaining nobles look around, decide that there is more than enough for all of them, and feel incentivized to cooperate with the formation of a strong centralized state.
This cycle is interwoven with a second 40-60 year process that T&N call the “fathers-and-sons cycle” or “bigenerational cycle”. The data tend to show waves of disorder about every 40-60 years. During the “integrative trend” (T&N’s term for the optimistic growth and stagflation phases), these can just be minor protests or a small rebellion that is easily crushed. During the “disintegrative trend” (crisis + depression), they usually represent individual outbreaks of civil war. For example, during the Roman Republic, the violence around the death of Tiberius Gracchus in 133 BC was relatively limited, because Rome had not yet entered its crisis phase. 40 years later, in the depths of the crisis phase, there was a second outbreak of violence (91 – 82 BC) including the Social War and Sulla’s wars, which escalated to full-scale (though limited) civil war. 40 years later there was a third outbreak (49 – 27 BC) including Caesar and Augustus’s very large civil wars. After that the new integrative trend started and further violence was suppressed.
In Secular Cycles, T&N mostly just identify this pattern from the data and don’t talk a lot about what causes it. But in some of Turchin’s other work, he applies some of the math used to model epidemics in public health. His model imagines three kinds of people: naives, radicals, and moderates. At the start of a cycle, most people are naive, with a few radicals. Radicals gradually spread radicalism, either by converting their friends or provoking their enemies (eg a terrorist attack by one side convinces previously disengaged people to join the other side). This spreads like any other epidemic. But as violence gets worse, some people convert to “moderates”, here meaning not “wishy-washy people who don’t care” but something more like “people disenchanted with the cycle of violence, determined to get peace at any price”. Moderates suppress radicals, but as they die off most people are naive and the cycle begins again. Using various parameters for his model Turchin claims this predicts the forty-to-sixty year cycle of violence observed in the data.
So this is the basic thesis of Secular Cycles. Pre-industrial history operates on two cycles: first, a three-hundred year cycle of the rise-and-fall of civilizations. And second, a 40-60 year cycle of violent disorder that only becomes relevant during the lowest parts of the first cycle.
II
This is all in the first chapter of the book! The next eight chapters are case studies of eight different historical periods and how they followed the secular cycle model.
For example, Chapter 7 is on the Roman Empire. It starts with Augustus in 27 BC. The Roman Republic has just undergone a hundred years of civil war, from the Gracchi to Marius to Sulla to Pompey to Caesar to Antony. All of this decreased its population by 30% from its second-century peak. That means things are set to get a lot better very quickly.
The expansion phase of the Empire lasted from Augustus (27 BC) to Nerva (96 AD), followed by a stagflation phase from Nerva to Antonius Pius (165 AD). Throughout both phases, the population grew – from about 40 million in Augustus’ day to 65 million in Antonius’. Wheat prices stayed stable until Nerva, then doubled from the beginning of the second century to its end. Legionary pay followed the inverse pattern, staying stable until Nerva and then decreasing by a third before 200. The finances of the state were the same – pretty good until the late second century (despite occasional crazy people becoming Emperor and spending the entire treasury building statues of themselves), but cratering during the time of Marcus Aurelius and Commodus (who debased the denarius down to only 2 g silver).
Throughout expansion and stagflation, the Empire was relatively peaceful (the “Pax Romana”). Sure, occasionally a crazy person would become Emperor and they would have to kill him. There was even one small civil war which lasted all of a year (69 AD). But in general, these were isolated incidents.
Throughout the expansion phase, upward mobility was high and income inequality relatively low. T&N measure this as how many consuls (the highest position in the Roman governmental hierarchy) had fathers who were also consuls. This decreased throughout the first century – from 46% to 18% – then started creeping back up during the stagflation phase to reach 32% at the end of the second century.
The crisis phase began in 165 AD at the peak of Rome’s population and wealth. The Antonine Plague ravaged the Empire, killing 30% of the population. Fifteen years later, the century-long dominance of the Good Emperors ended, and Commodus took the throne. Then he was murdered and Pertinax took the throne. Then he was murdered and Didius Julianus took the throne. Then he was murdered and Septimius Severus took the throne.
Now we are well into the disintegrative trend, and the shorter 40-60 year cycle comes into play. Septimius Severus founds a dynasty that lasts 41 years, until Septimius Alexander (the grandson of Septimius Severus’ sister-in-law; it’s complicated) was assassinated by his own soldiers in Germany. This begins the Crisis Of The Third Century, a time of constant civil war, mass depopulation, and economic collapse. The Five Good Emperors of the second century ruled 84 years between them (average of 17 years per emperor). The fifty year Crisis included 27 emperors, for an average of less than 2 years per emperor.
Finally, in 284, Emperor Diocletian ended the civil wars, re-established centralized authority, and essentially refounded the Roman Empire – a nice round 310 years after Augustus did the same. T&N mark this as the end of a secular cycle and the beginning of a new integrative trend.
T&N are able to tell this story. But they don’t just tell the story. They are able to cite various statistics to back themselves up. The Roman population statistics. The price of wheat and other foodstuffs. The average wages for laborers. They especially like coin hoards – the amount of buried treasure from a given period discovered by treasure-hunters – because they argue you only bury your money during times of instability, so this forms a semi-objective way of measuring how unstable things are.
They are at their best when presenting very broad summary statistics. For example, Roman industry produced vast amounts of lead, which entered the atmosphere and settled into the Greenland ice sheet. Here is Roman lead output per year as measured in ice cores:
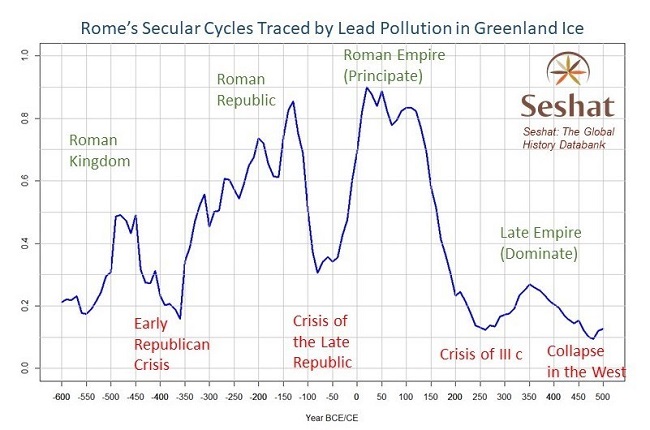
This shows four peaks for the four cycles T&N identify in Rome: the Kingdom, the Republic, the Early Empire of Augustus (Principate, the one described above), and the Late Empire of Diocletian (Dominate). It even shows a sawtooth-y pattern corresponding to the shorter bigenerational cycles.
Or here is building activity in Rome, measured by how many buildings archaeologists have found from a given time:
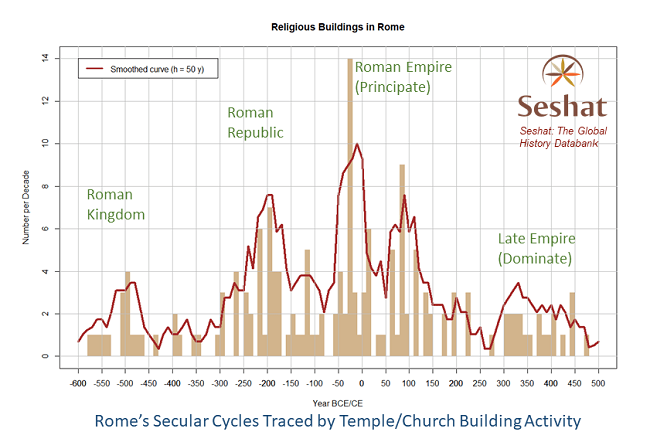
This is a little less perfect (why is there a big gap in the middle of the Principate? I guess Augustus is a hard act to follow, building-wise) but it still looks good for the cycle theory.
And here is an Index Of Political Instability, which “combines measures of duration, intensity, and scale of political instability events, coded by a team of professional historians”:
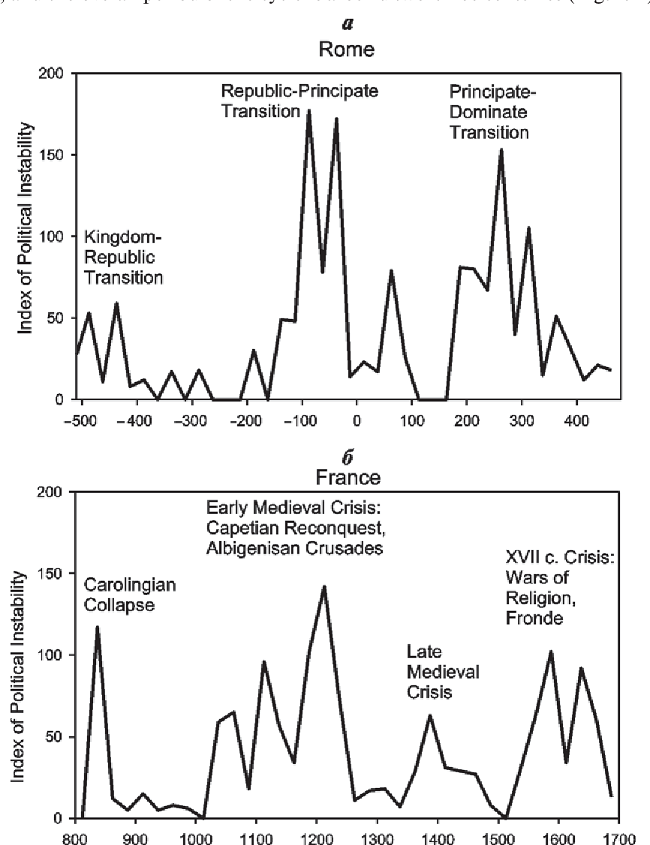
Rome is the one on top. Instability clearly peaks during the crisis-depression phases between T&N’s secular cycles – again with a sawtooth pattern representing the bigenerational cycles.
III
Seeing patterns in random noise is one of the basic human failure modes. Secular Cycles is so prima facie crackpottish that it should require mountains of data before we even start wondering if it might be true. I want to make it clear that the book – plus Turchin individually in some of his other books and papers – provides these mountains. I can’t show every single case study, graph, and table in this book review. But the chapter above on the Roman Principate included 25 named figures and graphs, plus countless more informal presentations of data series, from “real wages of agricultural laborers in Roman Egypt during the second century” to “mean annual real land rents for wheat fields in artabas per aroura, 27 BC to 268 CE” to “imperial handouts per reign-year” to “importation of African red slip ware into the Albegna Valley of Etruria, 100 – 600”. And this is just one chapter, randomly chosen. There are seven others just like this. This book understands the burden of proof it is under, and does everything it can to meet it.
Still, we should be skeptical. How many degrees of freedom do T&N have, and is it enough to undermine their case?
First, they get some freedom in the civilizations they use as case studies. They could have searched through every region and period and cherry-picked eight civilizations that rose and fell over a periods of three hundred years. Did they? I don’t think so. The case studies are England, France, Rome, and Russia. These are some of the civilizations of greatest interest to the English-speaking world (except Russia, which makes sense in context because the authors are both Russian). They’re also some of the civilizations best-studied by Anglophone historians and with the most data available (the authors’ methodology requires having good time-series of populations, budgets, food production, etc).
Also, it’s not too hard to look at the civilizations they didn’t study and fill in the gaps. The book barely mentions China, but it seems to fit the model pretty well (“the empire united longs to divide; divided longs to unite”). In fact, taking the quotation completely seriously – the empire was first united during the Qin Dynasty starting in 221 BC, which lasted only 20 years before seguing into the Han Dynasty in 202 BC. The Han expanded and prospered for about a century, had another century of complicated intrigue and frequently revolt, and then ended in disaster in the first part of the first century, with a set of failed reforms, civil war, the sack of the capital, some more civil war, peasant revolt, and even more civil war. The separate period of the Eastern Han Dynasty began in 25 AD, about 240 years after the beginning of the Qin-Han cycle. The Eastern Han also grew and prospered for about a hundred years, then had another fifty years of simmering discontent, then fell apart in about 184 AD, with another series of civil wars, peasant rebellions, etc. This was the Three Kingdoms Period during which “the empire united longs to divide, divided longs to unite” was written to describe. It lasted another eighty years until 266 AD, after which the Jin Dynasty began. The Jin Dynasty was kind of crap, but it lasted another 180 years until 420, followed by 160 years of division, followed by the Sui and Tang dynasties, which were not crap. So I don’t think it takes too much pattern-matching to identify a Western-Han-to-Eastern-Han Cycle of 240 years, followed by an Eastern-Han-to-Jin Cycle of 241 years, followed by a Jin-to-Sui/Tang-Cycle of 324 years.
One could make a more hostile analysis. Is it really fair to lump the Western Jin and Eastern Jin conveniently together, but separate the Western Han and Eastern Han conveniently apart? Is it really fair to call the crappy and revolt-prone Jin Dynasty an “integrative trend” rather than a disintegrative trend that lasted much longer than the theory should predict? Is it really fair to round off cycles of 240 and 320 years to “basically 300 years”?
I think the answer to all of these is “T&N aren’t making predictions about the length of Chinese dynasties, they’re making predictions about the nature of secular cycles, which are correlated with dynasties but not identical to them”. If I had the equivalent to lead core readings for China, or an “instability index”, or time series data for wages or health or pottery importation or so on, maybe it would be perfectly obvious that the Eastern and Western Han defined two different periods, but the Eastern and Western Jin were part of the same period – the same way one look at the lead core data for Rome shows that the Julio-Claudian dynasty vs. the Flavian Dynasty is not an interesting transition.
A secondary answer might be that T&N admit all sorts of things can alter the length of secular cycles. They tragically devote only a few pages to “Ibn Khaldun cycles”, the theory of 14th century Arabic historian Ibn Khaldun that civilizations in the Maghreb rise and fall on a one hundred year period. But they discuss it just enough to say their data confirm Ibn Khaldun’s observations. The accelerated timescale (100 vs. 300 years) is because the Maghreb is massively polygynous, with successful leaders having harems of hundreds of concubines. This speeds up the elite overproduction process and makes everything happen in fast-forward. T&N also admit that their theory only describes civilizations insofar as they are self-contained. This approximately holds for hegemons like Rome at its height, but fails for eg Poland, whose history is going to be much more influenced by when Russia or Germany decides to invade than by the internal mechanisms of Polish society. Insofar as external shocks – whether climatic, foreign military, or whatever else – affect a civilization, secular cycles will be stretched out, compressed, or just totally absent.
This sort of thing must obviously be true, and it’s good T&N say it, but it’s also a free pass to add as many epicycles as you need to explain failure to match data. All I can say looking at China is that, if you give it some wiggle room, it seems to fit T&N’s theories okay. The same is true of a bunch of other civilizations I plugged in to see if they would work.
Second, T&N get some degrees of freedom based on what statistics they use. In every case, they present statistics that support the presence of secular cycles, but they’re not the same statistics in every case. On the one hand, this is unavoidable; we may not have good wage data for every civilization, and levels of pottery importation might be more relevant to ancient Rome than to 19th-century Russia. On the other hand, I’m not sure what prevents them from just never mentioning the Instability Index if the Instability Index doesn’t show what they want it to show.
Here are some random Rome-related indicators I found online:
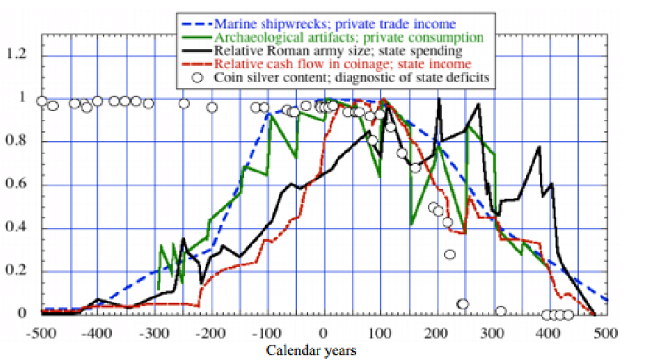
None of them show the same four-peaked Kingdom-Republic-Principate-Dominate pattern as the ones Secular Cycles cites, or the ones Turchin has online.
Third, a lot of the statistics themselves have some degrees of freedom. A lot of them are things like “Instability Index” or “Index of Social Well-Being” or “General Badness Index”. These seem like the kind of scores you can fiddle with to get the results you want. Turchin claims he hasn’t fiddled with them – his instability index is taken from a 1937 paper I haven’t been able to find. But how many papers like that are there? Am I getting too conspiratorial now?
Likewise, we don’t have direct access to the budget of the Roman Empire (or Plantagenet England, or…). Historians have tried to reconstruct it based on archaeology and the few records that have survived. T&N cite these people, and the people they cite are at the top of their fields and say what T&N say they say. But how much flexibility did they have in deciding which estimate of the Roman budget to cite? Is there enough disagreement that they could cite the high estimate for one period and the low estimate for another, then prove it had gone down? I don’t know (though a few hours’ work ought to be enough to establish this).
I wish I could find commentary by other academics and historians on Secular Cycles, or on Turchin’s work more generally. I feel like somebody should either be angrily debunking this, or else throwing the authors a ticker-tape parade for having solved history. Neither is happening. The few comments I can find are mostly limited to navel gazing about whether history should be quantitative or qualitative. The few exceptions find are blog posts by people I already know and respect urging me to read Turchin five years ago, advice I am sorry for not taking. If you know of any good criticism, please tell me where to find it.
Until then, my very quick double-checking suggests T&N are pretty much on the level. But there could still be subtler forms of overfitting going on that I don’t know enough about history to detect.
IV
If this is true, does it have any implications for people today?
First, a very weak implication: it makes history easier to learn. I was shocked how much more I remembered about the Plantagenets, Tudors, Capetians, etc after reading this book, compared to reading any normal history book about them. I think the secret ingredient is structure. If history is just “one damn thing after another”, there’s no framework for figuring out what matters, what’s worth learning, what follows what else. The secular cycle idea creates a structure that everything fits into neatly. I know that the Plantagenet Dynasty lasted from 1154 – 1485, because it had to, because that’s a 331 year secular cycle. I know that the important events to remember include the Anarchy of 1135 – 1153 and the War of the Roses from 1455 – 1487, because those are the two crisis-depression periods that frame the cycle. I know that after 1485 Henry Tudor took the throne and began a new age of English history, because that’s the beginning of the integrative phase of the next cycle. All of this is a lot easier than trying to remember these names and dates absent any context. I would recommend this book for that reason alone.
Second, I think this might give new context to Piketty on inequality. T&N describe inequality as starting out very low during the growth phase of a secular cycle, rising to a peak during the stagflation phase, then dropping precipitously during the crisis. Piketty describes the same: inequality rising through the peaceful period of 1800 to 1900, dropping precipitously during the two World Wars, then gradually rising again since then. This doesn’t make a huge amount of sense, since I’m not sure you can fit the post industrial world into secular cycles. But I notice Piketty seems to think of this as a once-off event – inequality has been rising forever, broken only by the freak crisis of the two World Wars – and it’s interesting to read T&N talk about the exact same process recurring again and again throughout history.
Finally, and most important: is there any sense in which this is still going on?
The easiest answer would be no, there isn’t. The secular cycles are based around Malthusian population growth, but we are now in a post-Malthusian regime where land is no longer the limiting resource. And the cycles seem to assume huge crises killing off 30% to 50% of the population, but those don’t happen anymore in First World countries; the Civil War was the bloodiest period of US history, and even it only killed 2% of Americans. Even Germany only lost about 15% of its population in World Wars I + II.
But Turchin has another book, Ages Of Discord, arguing that they do. I have bought it and started it and will report back when I’m done.
Even without a framework, this is just interesting to think about. In popular understanding of American history, you can trace out optimistic and pessimistic periods. The national narrative seems to include a story of the 1950s as a golden age of optimism. Then everyone got angry and violent in the early 1970s (the Status 451 review of Days Of Rage is pretty great here, and reminds us that “people have completely forgotten that in 1972 we had over nineteen hundred domestic bombings in the United States”). Then everything suddenly got better once Reagan declared “morning in America” in the 1980s, with an era of optimism and good feelings lasting through the Clinton administration. Then things starting to turn bad sometime around Bush II. And now everybody hates each other, and fascists and antifa are fighting in the streets, and people are talking about how “civility” and “bipartisanship” are evil tools of oppression, and PredictIt says an avowed socialist has a 10% chance of becoming president of the US. To what extent is this narrative true? I don’t know, but it’s definitely the narrative.
One thing that strikes me about T&N’s cycles is the ideological component. They describe how, during a growth phase, everyone is optimistic and patriotic, secure in the knowledge that there is enough for everybody. During the stagflation phase, inequality increases, but concern about inequality increases even more, zero-sum thinking predominates, and social trust craters (both because people are actually defecting, and because it’s in lots of people’s interest to play up the degree to which people are defecting). By the crisis phase, partisanship is much stronger than patriotism and radicals are talking openly about how violence is ethically obligatory.
And then, eventually, things get better. There is a new Augustan Age of virtue and the reestablishment of all good things. This is a really interesting claim. Western philosophy tends to think in terms of trends, not cycles. We see everything going on around us, and we think this is some endless trend towards more partisanship, more inequality, more hatred, and more state dysfunction. But Secular Cycles offers a narrative where endless trends can end, and things can get better after all.
Of course, it also offers a narrative where sometimes this process involves the death of 30% – 50% of the population. Maybe I should read Turchin’s other books before speculating any further.